
 Houston Goodwin
The Power of Collaboration
I used to mail a card to my volunteers with a handwritten message inside. The outer design was drawn by one of my coworkers and featured several...

Featured Posts


I used to mail a card to my volunteers with a handwritten message inside. The outer design was drawn by one of my coworkers and featured several...
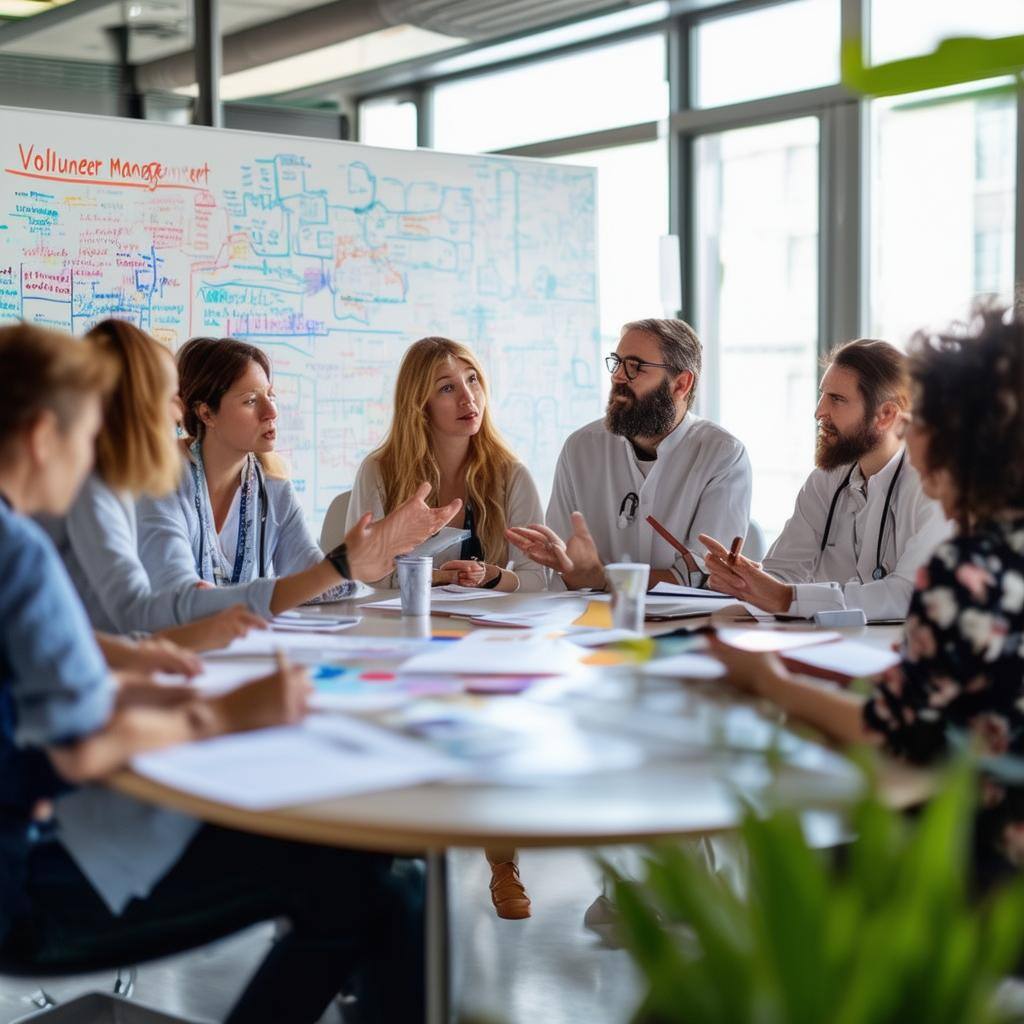
In a world where volunteerism continues to shape healthcare communities, professional certifications in volunteer management are becoming a key asset...